EmitoMetrix is an AI-based tool designed to analyze mitochondria from Electron microscopy images, using advanced segmentation and data processing algorithms.
1 . Installation
Installation instructions are available on the installation page, which includes step-by-step video tutorials.
- Visit the download page and select the appropriate version for your system (Windows, macOS, or Linux).
- Both CPU and GPU versions are available.
- Run the installer. A working internet connection is required during installation.
2 . Usage
After installation:
- Launch
fijifrom the installation folder. - The EmitoMetrix plugin will be available in the Fiji interface.
This tool provides a graphical interface. No command line usage is required.
3 . Configuration
No configuration is needed. The tool is fully functional out of the box. All environments and dependencies are installed automatically.
4 . Use Case
EmitoMetrix is built for researchers, especially in biology and medical fields, who need to process and analyze mitochondrial structures in microscopy images efficiently using AI-powered tools.
5 . Features
- Automated mitochondria segmentation using Cellpose
- Integration with Fiji as a plugin
- Automatic setup, no technical configuration required
- Generates analytical reports from processed images
- Generates predictive models based on mitochondrial morphology
- Supports multiple species (human, mouse, fly, zebrafish)
6 . Dependencies
- Bundled Anaconda environment
- Cellpose (for image segmentation)
- All necessary Python libraries
No additional software installation is required from the user.
7 . License
This section will be updated based on institutional policy.
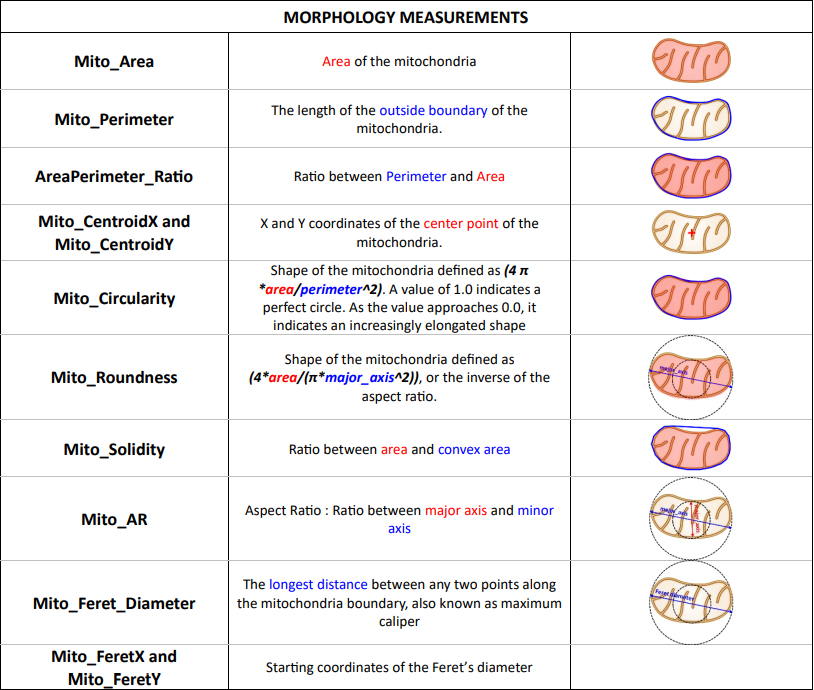
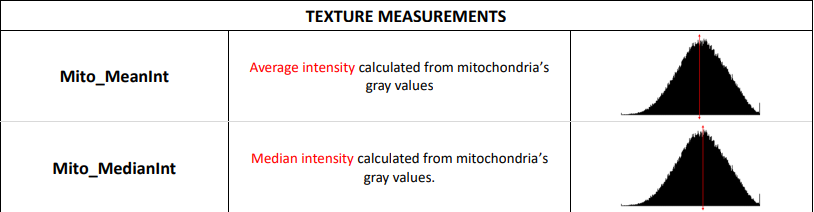
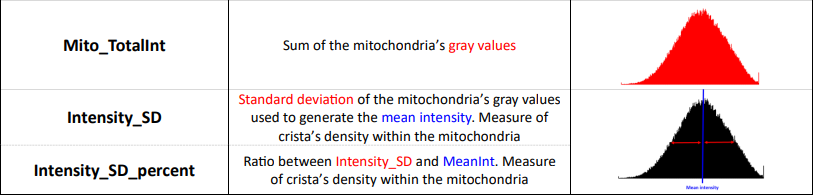
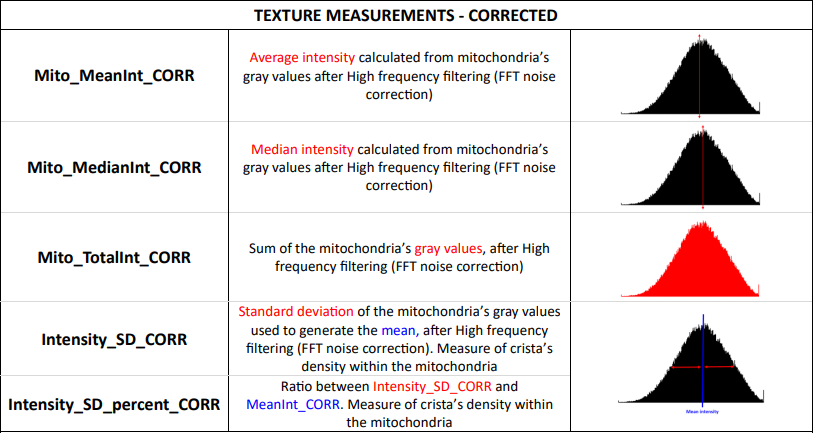
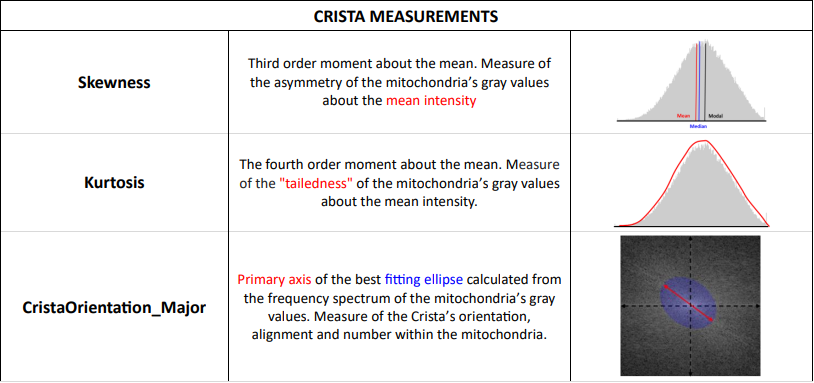
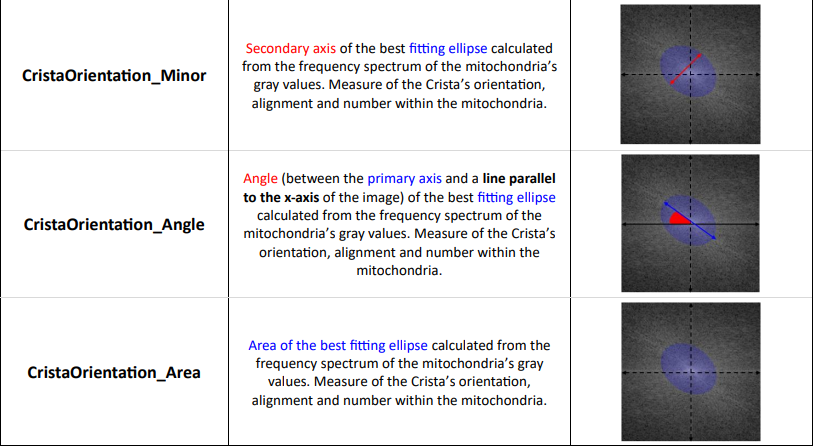
8 . Description of Mitochondria morphometrics

9 . Github
For more information and updates, please visit our GitHub repository.
10 . More documentation
For more detailed documentation, please refer to the Usages
11 . Our models
- Generalist-Fish_Model_GM-FISH_EM
- GeneralistModel_GM_EM
- SpecialistModel_SM_C-ELEGANS_EM
- SpecialistModel_SM_FLY_EM
- SpecialistModel_SM_HUMAN_EM
- SpecialistModel_SM_KILLIFISH_EM
- Specialist model SM_MOUSE_EM
- Specialist model SM_ZEBRAFISH_EM
12 . Example Usage
Detailled step
First step
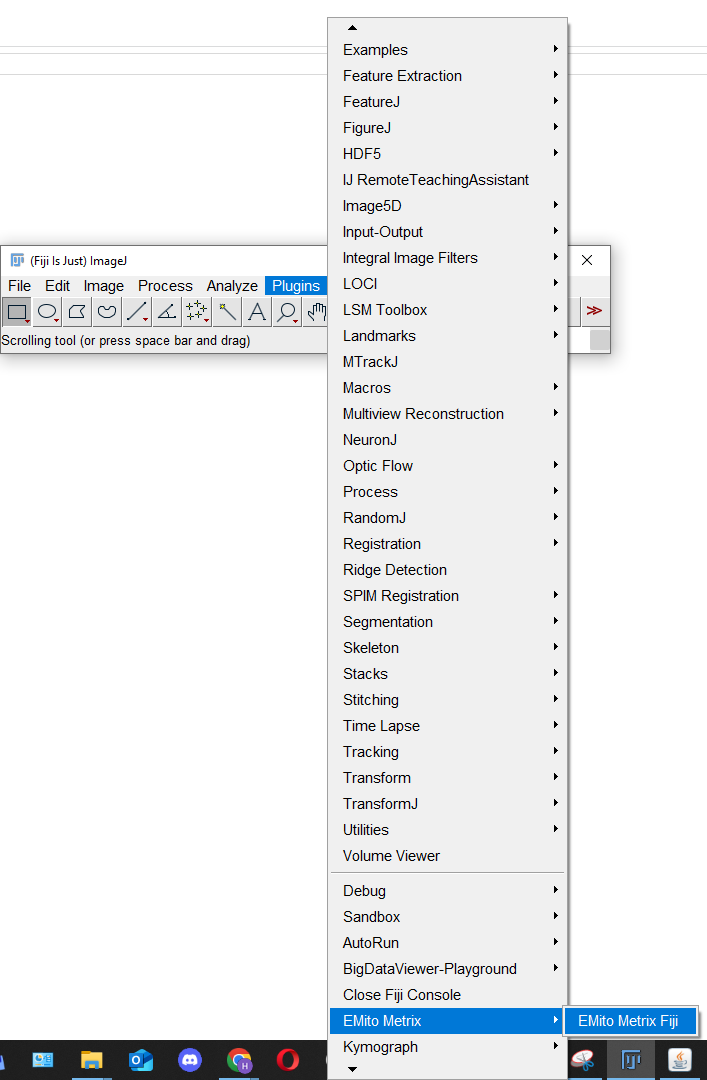
Open Fiji and select the EmitoMetrix plugin from the Plugins menu.
Second step
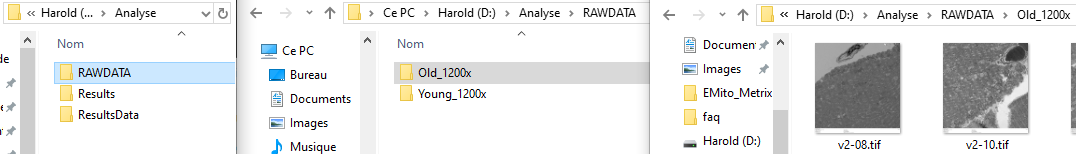
Choose the input folder containing your folder with images. You should have 2 levels of folders. The first level is the folder with images, and the second level is the images themselves. Exemple : RAWDATA/folderImages/image.tif
Choose the output folder where you want to save the results.
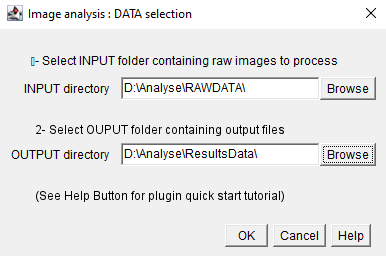
Click on OK
Third step
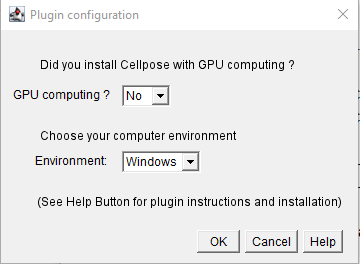
Choose your computer environment (CPU or GPU) and your system (Windows, Linux, or MacOS). Use Gpu if you have a compatible Nvidia GPU with CUDA installed.
Fourth step
Enter the name of your experiment and select custom.

Fifth step
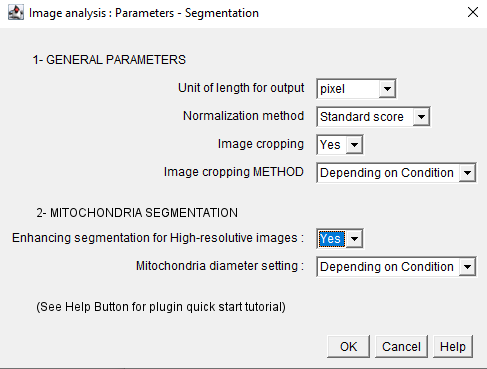
Choose the general settings for your experiment. You can crop the images and enhance the segmentation for High resolutive images.
Sixth step
Choose the model you want to use for your experiment. You can choose between species-specific or the generalist models.
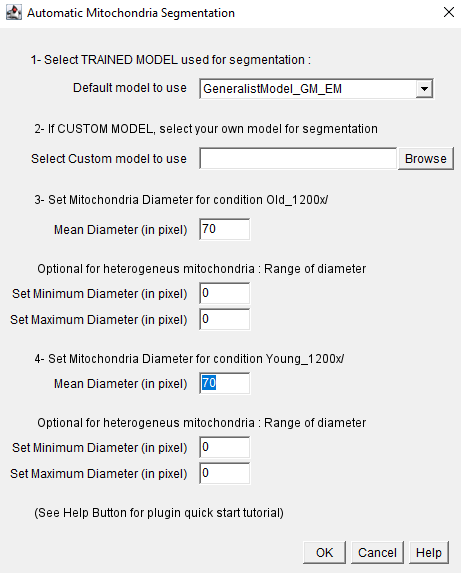
For each condition, set the MEAN diameter of mitochondria contained in your images. This value is required for segmentation process and must be set in pixels. If needed, set a minimum and/or a maximum value as the diameter of the thickest and largest mitochondria from your images. See the FAQ section for more information about the mitochondria diameter setting.
Seventh step
Click on Ok to start the segmentation process. You have to wait until the process is finished. The time depends on the number of images and the size of the images. You can see the progress in the Fiji console. After the process is finished, you will see a message in the Fiji console. And you have to validate the results by clicking on the validate button.
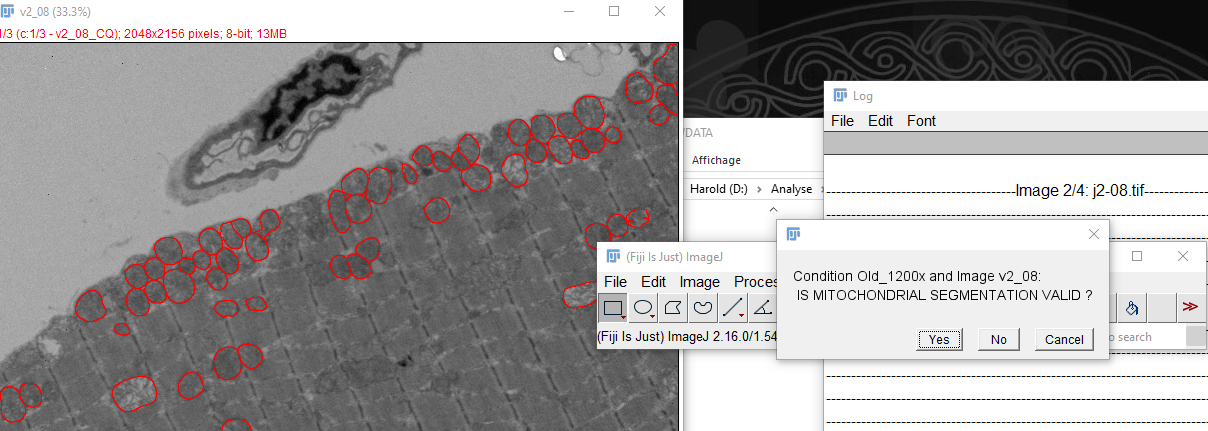
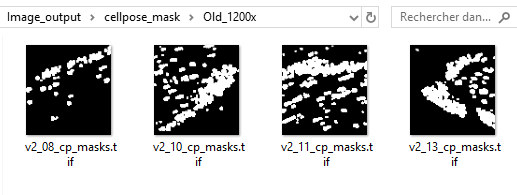
Eighth step
After the validation, you can see the cellpose mask in the results folder.
Ninth step
After that, the segmentation process is finished. Now you can restart EmitoMetrix plugin to Launch the
morphometric analysis. You have to rechoose the input and output folders. they will be the same as before.
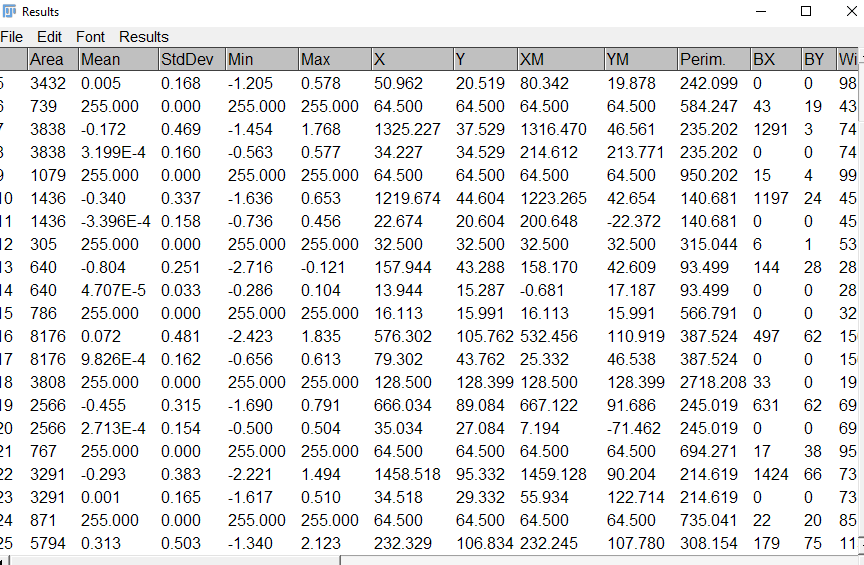
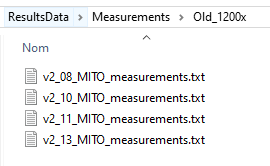
Tenth step
The measurement process is finished. You can see the results in the output folder.
Eleventh step
Now you have to restart EmitoMetrix plugin to Launch the data display or data prediction. You have to rechoose
the input and output folders. they will be the same as before.
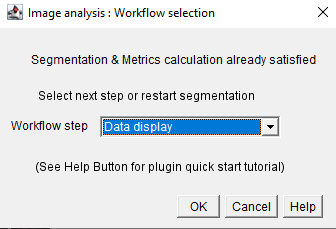
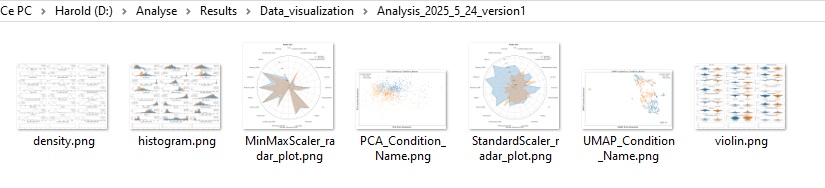
 if you choose the data display, this generates a report with the results of the morphometric analysis.
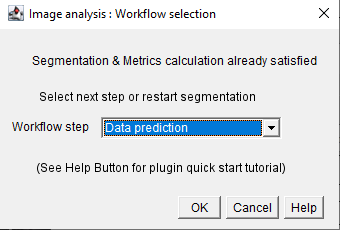
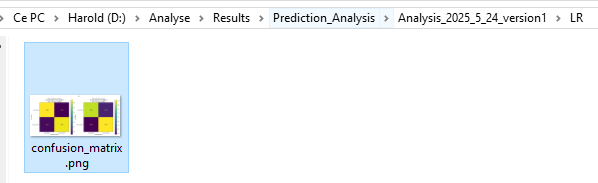
 if you choose the data prediction, this generates a report with the results of the morphometric analysis and the
predictive model with a confusion matrix.
if you choose the data prediction, this generates a report with the results of the morphometric analysis and the
predictive model with a confusion matrix.
ERROR MESSAGE
-
Checking FIJI plugin configuration --------------------------- ERROR
This message appears if one or more Fiji plugins (Cellpose-BIOP & Bio-Format) are missing. To solve this issue, please install these plugins from the Fiji’s help menu.
-
Checking input and output folders --------------------------- ERROR
Invalid folders are detected from the INPUT directory (Missing folders containing input images, for example). Please see the FAQ for input instructions.
Invalid folders are detected from the OUTPUT directory. Please see the FAQ for input instructions. -
Checking python and cellpose folders --------------------------- ERROR
Invalid Python folder or missing files. Please see the FAQ for installation instructions.
Invalid Cellpose environment or Cellpose folder. Please see the FAQ for installation instructions. -
Setting Data visualization parameters --------------------------- ERROR
User must select at least 3 or more Morphology & texture metrics for data display. Please see the FAQ for instructions.
-
Setting Morphology Analysis parameters --------------------------- ERROR
User must select at least 1 or more graph or data distribution to display. Please see the FAQ for instructions.
-
Setting Mitochondria Segmentation parameters --------------------------- ERROR
An invalid value has been set for Mitochondria Diameter (cellpose segmentation). An integer value (higher than 0) has to be set. Please see the FAQ for segmentation settings.
-
Setting Data computation parameters --------------------------- ERROR
No machine learning model has been selected for data prediction. Please see the FAQ for instructions.
-
Checking mitochondria diameter for segmentation
An invalid value has been set for Mitochondria Diameter (cellpose segmentation). An integer value (higher than 0) has to be set. Please see the FAQ for segmentation settings.
-
Setting Mitochondria Segmentation parameters --------------------------- ERROR
INPUT folder contains one or more images with invalid file format. Please convert input images using conventional format (TIF).
WARNING MESSAGE
-
Checking image format for segmentation
File format WARNING: File format selected (jpeg or jpg) has poor resolution compared to conventional format (TIFF). This can lead to lower quality results.
-
Checking for Data display settings
WARNING: Selecting Spatial clustering during data display step will increase calculation time.
-
Checking for Data computation settings
WARNING: Computing the explanation for MLP model will substantially increase calculation time.
-
Checking for General settings
Warning: Allowing image display during analysis will slow down macro execution.
-
Checking ROI for morphological analysis
No valid mitochondria ROI has been detected during segmentation step, for the image. Image not included for the three next steps.
-
Checking folder for segmentation
A non-valid condition folder has been detected in the INPUT directory. Folder not included for the three next steps.
-
Checking folder name for segmentation
A non-valid folder’s name has been detected in the INPUT directory (wrong characters). Folder not included for the three next steps. Please stop the analysis and rename the folder if necessary.
-
Checking folder content for segmentation
An empty folder has been detected in the INPUT directory (no input images). Folder not included for the three next steps.
-
Checking image name for segmentation
A non-valid image’s name has been detected in the INPUT directory (wrong characters). Image not included for the three next steps. Please stop the analysis and rename the image if necessary.